
Trading Basics
A beginner-friendly guide to Futures, Forex, Charts, Trends, Risk Management, and Trading Psychology
(Educational only — not financial advice.)
If you’re new to trading, the hardest part isn’t learning one “secret strategy.” It’s learning the language of markets and the rules of the game. Once you understand the basics, charts and trading discussions stop sounding like a foreign language.

This article is written for brand‑new traders anywhere in the world (USA, UK, Africa, etc.). I’ll use everyday examples — like shopping, driving, sports, and budgeting — so the ideas feel normal.
1) What market are we trading?
Most beginner traders start with one (or more) of these:
- Futures (exchange-traded contracts like /ES, oil, gold)
- Forex (FX) (trading currency pairs like EUR/USD)
- Stocks/Indices (like the S&P 500 or the Dow)
Even if you only plan to trade one market, learning the others helps you understand the “why” behind price movement.
2) Futures 101 (contract basics)
What is a futures contract?
A futures contract is a standardized agreement traded on an exchange to buy or sell something (an index, oil, gold, etc.) at a set price, with a specific expiration date.
Everyday example:
Think of a futures contract like a standard ticket for a concert with a fixed date.
- The ticket is standardized (everyone’s ticket is the same type).
- It has an “expiration” (the concert date).
- You can buy/sell the ticket before the date.
What “standardized” really means
“Standardized” means the exchange defines the rules, like:
- Contract size
- Tick size (minimum price movement)
- Trading hours
- Settlement method (cash or physical)
- Expiration months
So you’re not making up your own terms. That’s why futures are easier to trade than private deals.
3) Futures: the 5 specs that matter most
When you look at a futures product page, you’ll see a lot of info. For beginners, these are the most important:

1) Tick size
The tick size is the smallest price step that contract can move.
Everyday example:
If a store says an item costs $1.99, you can’t pay $1.993. Prices move in allowed increments.
Tick size is the market’s allowed increment.
2) Multiplier (contract size)
The multiplier tells you how much money you gain or lose when price moves.
Everyday example:
Imagine you’re buying bottled water:
- 1 bottle = 1 unit
- 1 case = 24 bottles
The multiplier is like trading the case, not a single bottle.
So a small price change can mean a bigger dollar change because you’re trading a “bundle.”
3) Tick value
Tick value = how much one tick is worth in dollars (or your account currency).
4) Settlement type (cash vs physical)
- Cash-settled: no delivery; your profit/loss is settled in cash.
- Physical delivery: the contract is designed for real delivery (like oil).
Most retail traders close positions before delivery.
5) Expiration / contract months
Futures don’t last forever — they have contract months (like March, June, Sept, Dec for many index futures).
4) Example futures product (easy example: Crude Oil CL)
A common non‑equity futures contract is WTI Crude Oil futures (CL).
What matters for beginners:
- Exchange: NYMEX
- Product code: CL
- Tick size: $0.01 per barrel
- Multiplier (contract size): 1,000 barrels
- Settlement: physical (most traders exit before delivery)
Why this matters:
If CL moves $1.00, your P/L changes by roughly $1,000 (because it’s 1,000 barrels).
That’s the multiplier doing its job.
5) Futures vs Forwards (2 big differences)
People confuse these a lot.
Difference #1: Where they trade
- Futures: trade on exchanges with public rules.
- Forwards: private agreements (OTC) between two parties.
Difference #2: Standardization & risk
- Futures: standardized, and the exchange clearing system reduces counterparty risk.
- Forwards: customized, and you rely more on the other side’s ability to pay.
Everyday example:
- Futures = buying a product on a big marketplace with buyer protection.
- Forwards = making a private deal with someone you met online.
6) Margin in futures (initial vs maintenance)
Margin confuses beginners because it’s not a “down payment.” It’s more like a security deposit.
Initial margin (one sentence)
Initial margin is the “good faith deposit” required to open a futures position.
Maintenance margin (one sentence)
Maintenance margin is the minimum balance you must keep to hold that position; below it, you may get a margin call.
Everyday example:
Renting an apartment:
- You pay a deposit (initial margin).
- You must keep your account in good standing (maintenance margin), or the landlord takes action.
7) Forex (FX) basics
What is spot Forex?
Spot Forex (spot FX) is exchanging one currency for another at today’s price for near-term settlement (typically about two business days for many pairs).
Base vs quote currency (EUR/USD)
A currency pair is written like EUR/USD:
- EUR = base currency (the “thing” you’re buying/selling)
- USD = quote currency (what you’re paying with)

If EUR/USD = 1.1000, it means:
- €1 costs $1.10
Everyday example:
When you travel and exchange money:
- You’re basically doing a base/quote exchange — just with a currency booth instead of a trading platform.
8) Pips and pipettes (FX’s “ticks”)
What is a pip?
A pip is the standard unit of movement in FX.
What is a pipette?
A pipette is one-tenth of a pip (an extra digit some brokers show).
Typical pip sizes (important)
- EUR/USD: 1 pip = 0.0001
- USD/JPY: 1 pip = 0.01

Everyday example:
Think of:
- Pip = 1 cent
- Pipette = a tenth of a cent
(Not perfect, but it helps you “feel” how small pip steps are.)
9) FX lot sizes (standard, mini, micro)
In spot FX, traders often size in “lots”:
- Standard lot: 100,000 units
- Mini lot: 10,000 units
- Micro lot: 1,000 units
Everyday example:
Buying drinks:
- Standard lot = a full pallet
- Mini lot = a case
- Micro lot = a single bottle pack
Same product, different size.
10) Spot FX vs FX futures (2 structural differences)
1) Where it trades / how it clears
- Spot FX: mostly OTC (networks of banks/dealers/brokers)
- FX futures: traded on an exchange with central clearing
2) Data transparency
- Futures: more centralized prints (often clearer volume/price reporting)
- Spot FX: data can be fragmented across venues
11) Rollover / swap in spot FX (one sentence)
Rollover (swap) is the daily interest adjustment (credit or debit) applied when you hold a spot FX position past the broker’s daily cutoff.
Everyday example:
Borrowing money overnight: you might pay interest — or earn it — depending on the rates involved.
12) What is an index?
What is a stock market index?
A stock market index is a calculated number designed to track the performance of a group (basket) of stocks.
Everyday example:
An index is like a “team scoreboard.”
You don’t need to know every player’s stats to know if the team is winning.
S&P 500: cap-weighted or price-weighted?
The S&P 500 is market-cap weighted (bigger companies influence the index more).
Dow Jones: cap-weighted or price-weighted?
The Dow Jones Industrial Average is price-weighted (higher-priced stocks influence it more).
13) /ES Futures — what it represents (E-mini S&P 500)
What does /ES track?
/ES is the E-mini S&P 500 futures contract — it tracks the S&P 500 Index.
Why traders like /ES
Because it’s:
- Very liquid (lots of buyers/sellers)
- Tight spreads (often)
- Often reacts strongly to major news
/ES multiplier, tick size, tick value (beginner view)
Key ideas (in plain terms):
- Multiplier: how much one point is worth
- Tick size: smallest allowed move
- Tick value: dollars per tick
For /ES:
- Tick size is 0.25 index points
- Tick value is $12.50
- That means 4 ticks = 1 point
- And 1 point = $50 (because 4 × $12.50 = $50)
/MES (Micro E-mini S&P 500)
/MES is the micro version of /ES — about 1/10 the size.
Simple explanation:
- /ES is like buying a full-size pizza
- /MES is like buying a slice
Same flavor, smaller risk per move.
Price limits (limit up/down) in one sentence
Price limits are exchange rules that temporarily restrict how far price can move (up or down) to reduce disorder during extreme volatility.
14) Charts 101: What is a chart?
What is a price chart (one line)?
A price chart is a visual record of price movement over time.
3 common chart types (with one key difference)
- Candlestick chart: shows open, high, low, close (OHLC) in a visual way.
- Bar chart: also shows OHLC, but looks like thin bars (less “pattern” visual).
- Heikin-Ashi: uses a smoothing formula, so candles don’t show true OHLC (trends look cleaner, but it’s not raw price).
15) Candlesticks (OHLC) — the language of trading
Candlestick parts (simple definitions)
Every candle has:
- Open: first price in that time period
- High: highest price
- Low: lowest price
- Close: last price
- Body: the open-to-close “block”
- Wicks/shadows: the thin lines above/below the body

What a long upper wick can suggest
A long upper wick often suggests:
- Price pushed up, but sellers pushed it back down (rejection).
Everyday example:
You try pushing a heavy door open. It moves… then slams back.
That “push and rejection” is like a long upper wick.
What a long lower wick can suggest
A long lower wick often suggests:
- Price dropped, but buyers pushed it back up (rejection of lower prices).
Red vs green candles + “range”
If the candle closes below it opened, many platforms color it red (or black).
Range means: high minus low of the candle.
Candlestick vs line chart (one sentence)
Candlesticks show the full OHLC story, while line charts usually show only closes.
16) Why candles are popular (candles vs line)
Two things candles show that line charts don’t
- Open price (important for many strategies)
- Wicks (high/low extremes) that show rejection and volatility
Why traders prefer candles (2 reasons)
- You can “feel” momentum and rejection quickly (body size + wicks).
- They make market structure easier to see (swings, breaks, failures).
When a line chart is fine
A line chart is fine when you only care about the close, like:
- long-term trend overview
- quick “is it generally up or down?” check
17) Time frames (5-minute, 1-hour, daily)
What is a chart time frame?
A time frame is how much time each candle represents (5 minutes, 1 hour, 1 day, etc.).

What different time frames help you see
- 5-minute: short-term moves, entries, quick shifts in momentum
- 1-hour: clearer intraday structure without too much noise
- Daily: bigger trend, major levels, “where are we in the big picture?”
Multi-time-frame analysis (HTF vs LTF)
- Use HTF (higher time frame) to find the trend and important levels.
- Use LTF (lower time frame) to time entries and manage risk.
Everyday example:
It’s like using maps:
- HTF = seeing the whole city
- LTF = seeing the specific streets
18) Trend + market structure (HH, HL, LH, LL)
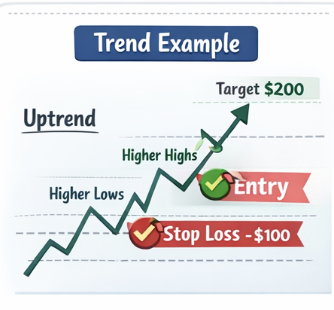
Many beginners say “the trend is up” without proof. Market structure gives a simple proof.




Trend (simple)
A trend is the direction of price swings over time.
The 4 structure labels

- HH (Higher High): a swing high higher than the previous swing high
- HL (Higher Low): a swing low higher than the previous swing low
- LH (Lower High): a swing high lower than the previous swing high
- LL (Lower Low): a swing low lower than the previous swing low
Rule of thumb (super important)
- Uptrend: HH + HL repeating
- Downtrend: LL + LH repeating
- Range: neither side makes consistent progress
Everyday example:
Think of hiking:
- Uptrend = you keep reaching higher peaks (HH) and your resting spots are also higher (HL).
- Downtrend = each peak is lower (LH) and you keep falling to lower valleys (LL).
- Range = you’re walking around the same area.
19) Long and short entries (simple)
Long entry (one line)
A long entry means you enter a position expecting price to go up.
Short entry in futures (no borrowing needed)
A short entry in futures means you sell to open, expecting price to go down (no borrowing shares like stock shorting).
Can you open a short as easily as a long in futures?
Yes — futures are built so shorting is usually as direct as going long.
20) Stop-loss and Risk-to-Reward (R:R)
Stop-loss (plain English)
A stop-loss is a pre-set exit that limits your loss if price moves against you.
Everyday example:
It’s like wearing a seatbelt. You don’t plan to crash — but you plan for the possibility.
Risk-to-reward (simple)
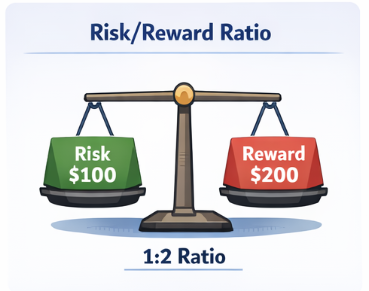
Risk-to-reward (R:R) compares what you risk to what you aim to make.
Example:
- Risk $100 to make $200 = 1:2 R:R
Why this matters:
You don’t need to win every trade if your winners are bigger than your losers.


21) Fundamental analysis vs technical analysis
Fundamental analysis (one line)
Fundamental analysis looks at economic and financial information to estimate value/direction.
Key U.S. fundamentals traders watch
- CPI (inflation)
- NFP (jobs report)
- Federal Reserve (interest rates)
Technical analysis (one line)
Technical analysis uses charts (price behavior) to make decisions.
Simple TA words you must know
- Support: area where buying tends to show up (price “floor”)
- Resistance: area where selling tends to show up (price “ceiling”)
- Momentum: how strongly price is moving (speed/strength)
Two easy ways to spot support/resistance
- Previous swing highs/lows (turning points)
- Big round numbers (like 1.1000 in EUR/USD) and prior day highs/lows
22) Why day traders often use TA more than fundamentals (FX & futures)
Fundamentals matter — but intraday trading is a timing game.
Three intraday reasons traders lean on TA
- Timing: charts help with precise entries/exits.
- Microstructure: liquidity and volatility shift minute-to-minute.
- Scheduled news: price often spikes first; TA helps manage the reaction.
How to react after big news (2–3 simple sentences)
After a news spike, don’t guess the headline impact. Let price show direction, then watch how it behaves around key levels (prior high/low, session open, major structure). Trade only if the market forms a clear setup (like break-and-retest), and keep risk controlled.
23) Risk management (the part that keeps you in the game)
A lot of beginners focus on “how to win,” but professionals focus on “how not to blow up.”

What is risk management?
Risk management is the rules you use to control losses:
- per trade
- per day
- per week
Everyday example:
Budgeting. If you spend your entire paycheck on day 1, the month is over.
If you risk too much on one trade, your trading journey ends early.
Position sizing (the missing skill for most beginners)
Position sizing means choosing how many contracts/lots to trade based on:
- your stop-loss distance
- your max $ risk
Simple position sizing formula
Position size = (Max $ risk per trade) ÷ (Stop distance in $)
Quick FX example (easy numbers)
- Account rule: risk $10 per trade
- Stop distance: 10 pips
- For EUR/USD, 1 mini lot ≈ $1/pip (rough rule)
- 10 pips × $1/pip = $10 risk → 1 mini lot fits
Quick futures example (using tick value thinking)
If one tick costs you $12.50 and your stop is 16 ticks:
- 16 × $12.50 = $200 risk per contract
If your max risk is $100, you can’t trade 1 full contract with that stop — you must: - use a smaller product (like micro)
- reduce stop distance
- or not take the trade
Overtrading = hidden risk
Even if each trade is “small,” too many trades can create big damage through:
- fees/spreads
- fatigue
- emotional decisions
24) Trading psychology (this is where most beginners struggle)
Trading is one of the few skills where:
- you can do everything “right”
- and still lose on that trade
That messes with people emotionally.

What is trading psychology?
Trading psychology is managing emotions (fear, greed, impatience, frustration) so you can follow your plan consistently.
Revenge trading (what it is)
Revenge trading is taking impulsive trades after a loss to “win it back.”
It usually leads to:
- bigger position sizes
- worse entries
- ignoring your stop-loss
Everyday example:
It’s like missing one shot in basketball and then forcing bad shots to “make up for it.”
That usually makes the team lose faster.
Why overtrading happens
Overtrading often comes from:
- boredom (“I need action”)
- FOMO (“I can’t miss this move”)
- anger (“I’ll get it back”)
- lack of rules (“I’ll just trade what I feel”)
How to prevent revenge trading and overtrading (simple rules)
You can teach students rules like:
- Max trades per day (example: 3 trades max)
- Max loss per day (example: stop after -2R or -$X)
- Mandatory break after a loss (example: 10–20 minutes away from the screen)
- Only trade your session (example: London session or NY morning, then stop)
- Journal every trade (a quick screenshot + “why I entered”)
Everyday example:
Professional drivers don’t speed all day. They follow rules because one mistake can end the race.
25) A simple “beginner checklist” for students
Before any trade, ask:
- What market am I trading? (FX or futures?)
- What’s the trend on the higher time frame?
- Where are support/resistance levels?
- What is my entry and stop-loss?
- What is my target and R:R?
- What is my position size for my max risk?
- What’s my daily max loss?
- Am I calm — or emotional (revenge/FOMO/boredom)?
If any answer is unclear, the trade is not ready.




Official reference pages
CME Crude Oil (CL) contract specs:
https://www.cmegroup.com/markets/energy/crude-oil/light-sweet-crude.contractSpecs.futures.html

CME WTI product overview:
https://www.cmegroup.com/education/courses/introduction-to-crude-oil/product-overview/wti-overview.html

CME E-mini S&P 500 educational overview:
https://www.cmegroup.com/education/lessons/product-e-mini-s-and-p.html

CME tick movements (useful for teaching tick size/value):
https://www.cmegroup.com/education/courses/introduction-to-futures/tick-movements-understanding-how-they-work

CME Micro E-mini S&P 500 specs:
https://www.cmegroup.com/markets/equities/sp/micro-e-mini-sandp-500.contractSpecs.html

CME price limits / banding:
https://www.cmegroup.com/education/courses/introduction-to-futures/price-limits-price-banding.html

S&P 500 Index info:
https://www.spglobal.com/spdji/en/indices/equity/sp-500/

Dow Jones Industrial Average info:
https://www.spglobal.com/spdji/en/indices/equity/dow-jones-industrial-average/

BLS CPI:
https://www.bls.gov/cpi/

BLS Jobs / CES (NFP source):
https://www.bls.gov/ces/

Federal Reserve policy rate overview:
https://www.federalreserve.gov/economy-at-a-glance-policy-rate.htm